
Astronomers know that if white light passes through a prism and is bent, it’s separated out into its component colors—the colors of the rainbow.
Astronomers also know that when light interacts with atoms, the building blocks of the universe, the atoms absorb photons of light and reemit them—but in a different direction.
Put these two bits of knowledge together, and astronomers now have everything they need to understand spectra (the plural for spectrum).
A spectrum is something I’ve covered in previous posts. In astronomy, it means the wavelengths of electromagnetic radiation spread out so we can analyze them individually. And it’s an astronomer’s most valuable tool.
So, what exactly is a spectrum, and how can we use it to analyze radiation from space and learn more about the universe?
We start with a continuous spectrum, the most basic kind of spectrum.

You no doubt recognize this. It’s your basic spectrum of the colors of the rainbow. You may not have seen it portrayed quite like this—you’re probably more used to seeing it as an arc through the sky after a rainstorm—but this probably isn’t unfamiliar.
A continuous spectrum is produced when any object emits light. Simple as that. In astronomy, that object is usually going to be a star. Here’s the thing, though. Astronomers rarely deal with continuous spectra—and they don’t tell us much, anyway.
See, when a star emits light, that light has to pass through the gases of the star’s atmosphere. Stars have a surface layer and an atmosphere same as planets.
And when light passes through a star’s atmosphere, the atoms there will absorb a bit and scatter it so that it never reaches our telescopes.
Each atom on the periodic table scatters certain wavelengths of light. So when astronomers analyze any one star’s spectrum, that continuous spectrum will have little gaps in it where those certain wavelengths got scattered.
It’ll look something like this…
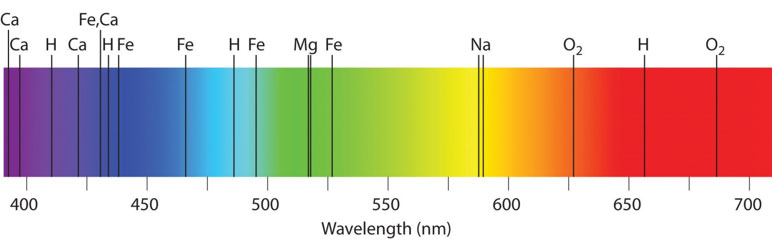
This is called an absorption spectrum, also known as a dark-line spectrum. The dark lines are called absorption lines. Each one of these lines represents where atoms in the solar atmosphere blocked a certain wavelength of light.
Notice how powerful a tool spectra can be. If you can spread a star’s light out into a spectrum, this is what you’ll see—and you can know exactly what that star is made of. And as you’ll see in posts coming up, you can also tell how old a star is.
Here’s the catch, though. Not every object in the universe emits a continuous spectrum of light.
This is true in the case of an excited gas. Gases in space aren’t like stars—they don’t emit all the wavelengths of radiation. They can’t. They can only emit those few wavelengths that their materials can produce.
Instead of a continuous spectrum, we’ll get an emission spectrum.

An emission spectrum is also known as a bright-line spectrum, and the lines are called emission lines.
In this case, the black parts of the spectrum aren’t because of light getting scattered. Those parts were empty to begin with. The bright lines represent the few elements whose atoms are emitting light.
No matter what kind of spectrum we get, the same lines will always be produced. Each atom will always scatter the same wavelengths.
So no matter if we’re looking at emission lines produced by hot hydrogen gas or absorption lines produced by a star with a hydrogen atmosphere, that hydrogen will produce bright or dark lines in the exact same places along a spectrum.

Notice here that the top two spectra show hydrogen lines, the middle two show carbon lines, and the bottom two show oxygen lines. But no matter which atom we’re looking at, the lines always appear in the same place for both absorption and emission.
What’s more, no two atoms have the same spectral lines. So astronomers can easily tell what an object is made of just by looking at its spectrum, be it emission or absorption.
Spectra don’t actually tell us much when we represent them as bands of light, though. These days, astronomers are more fond of representing spectra on graphs of wavelength vs. intensity.

This is an absorption spectrum, represented as both a band of light, and a graph.
Notice that the sharp dips in the graph correspond directly to the absorption lines above. The numbers at the bottom measure wavelength and represent the different colors of light. Intensity, on the vertical axis, represents how much of that wavelength is present.
Naturally, the wavelengths that are being scattered will be less intense—so they show up as dramatic dips on the graph.
Why would astronomers want to complicate their lives by looking at a graph instead of a rainbow? Because the graph shows details that aren’t visible on the rainbow. Notice the general curve of the graph, as well as the smaller dips that are present throughout.
The advantage of such a graph is that it shows astronomers where even the wavelengths that do come through are weaker or stronger. Whatever star we’re analyzing here, we can learn about it in much more detail.
Emission graphs are basically the opposite of absorption graphs, as you might expect. They basically show where there are spikes of radiation coming through at certain wavelengths, so they’re absorption graphs upside down.

Notice that this graph shows where most wavelengths are almost nonexistent, but a few specific ones have high intensities. This would correspond to a mostly black spectrum with a few bright emission lines where radiation is being emitted.
Here’s another advantage of graphing spectra rather than showing them as bands of color. Spectra don’t just help us analyze visible light. We can get emission and absorption spectra from other wavelengths of the electromagnetic spectrum.
Infrared and ultraviolet radiation, for example, are invisible to the human eye. There’s no easy way to represent them on a rainbow. We could use false color, but how would we tell it apart from the colors of visible light?
On a graph, we can let the horizontal axis show the entirety of the electromagnetic spectrum. Then dramatic dips or spikes can represent bright or dark lines, and we’ll know exactly what they mean no matter where they are on the graph.
Next up, we’ll take a look at a way we can measure a star’s temperature.

I admit, I’m not done reading but just wanted to say how much I like this already now…now back to reading…
LikeLiked by 1 person
Lol.
LikeLiked by 1 person