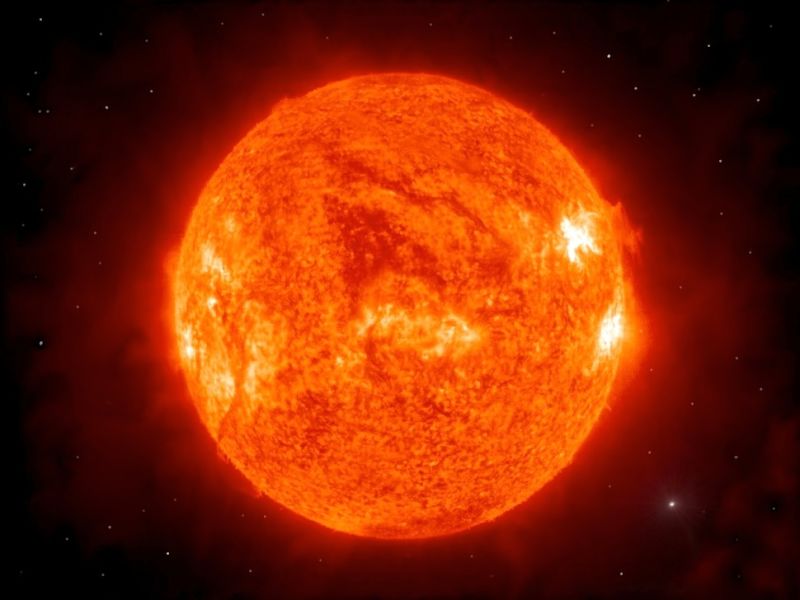
How hot would you say this star is? Take a wild guess.
Well…sorry, but I’m going to stop you for a moment just to make sure we’re all using Kelvins. The Kelvin scale is like the Celsius scale, except water freezes at 273 K instead of 0℃. 0 K is absolute zero, which is purely theoretical and doesn’t exist.
Now can you guess this star’s temperature?
I’ll give you another hint. This is a real photograph, so it’s impossible for this star to be any star other than our sun. How hot do you think our sun is?
Okay…I’ll tell you. It’s about 5800 K, which—for those of you unfamiliar with Kelvins—is about 5527℃. Kinda crazy, huh?
Next question. How do we know this? I mean, it’s not like we stuck a thermometer in the sun’s surface and actually measured it, right?
Right. But astronomers have their own special outer space thermometer, and it has to do with the sun’s spectral lines.
To recap from my last post, spectral lines are lines that appear on a spectrum. This spectrum includes all radiation on the electromagnetic spectrum, such as visible light.
Absorption spectra show all wavelengths of radiation emitted by an object such as a star, except dark lines cross the spectrum wherever certain atoms scatter the radiation and prevent it from reaching astronomers’ instruments.
Emission spectra, on the other hand, are entirely dark save for a few bright lines wherever atoms in hot gas emit radiation at specific wavelengths.
Atoms emit certain wavelengths of light when they either collide with other atoms or absorb a photon of light, which excites their electrons…
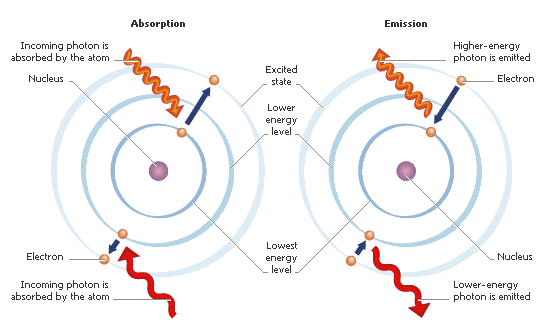
And these excited electrons gain the energy to wrest themselves away from the central nucleus and jump up one or more energy levels.
Any one atom has tons of energy levels. Electrons normally sit as close to the nucleus as they can fit. But, given exactly the right amount of energy, they can transition to a different energy level.
Let’s take a look at the different energy levels of an atom.
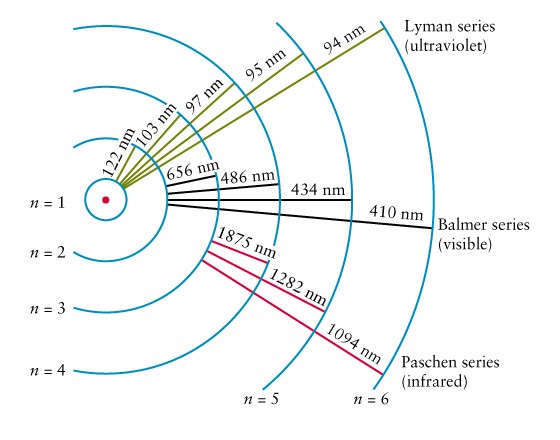
Electrons can transition to a higher energy level from any lower energy level. We’re going to focus just on the first three energy levels.
Transitions to any energy level from the first energy level are part of what we call the Lyman series. Likewise, transitions from the second energy level are part of the Balmer series. And transitions from the third energy level are part of the Paschen series.
Astronomers know exactly where to find these series on an absorption or emission spectrum. Here’s a hydrogen spectrum showing lines from the Lyman, Balmer, and Paschen series.

These are neither absorption lines nor emission lines; they just show where such lines would appear on either an absorption or emission spectrum. Only a few lines in the Balmer series are visible to human eyes.
For this post, let’s focus on the Balmer series—specifically for hydrogen. A hydrogen atom has only one electron, so it’s going to prefer to be in the first energy level.
But that electron has to transition to the second energy level in order to produce Balmer lines.
In a star, the only way for hydrogen’s electron to get to the second energy level is by colliding with another atom’s electron and gaining enough energy that way. This happens in all stars—stars are by definition hot enough for lots of collisions.
But here’s the catch. All stars may be hot enough for lots of collisions, but the number of collisions will still be different from star to star. And it depends on temperature.
A cooler star has atoms that are a bit less excited, and don’t collide quite as often. There will be fewer hydrogen atoms with their electron on the second energy level. That means Balmer lines will be less dramatic, less intense.
A hotter star is the same way—collisions will be that much more likely, but atoms’ electron will often be forced up to the third energy level. Those electrons won’t produce Balmer lines.
This way, astronomers know that Balmer lines will be the strongest in stars of medium temperature. The majority of atoms in these stars are emitting Balmer lines.
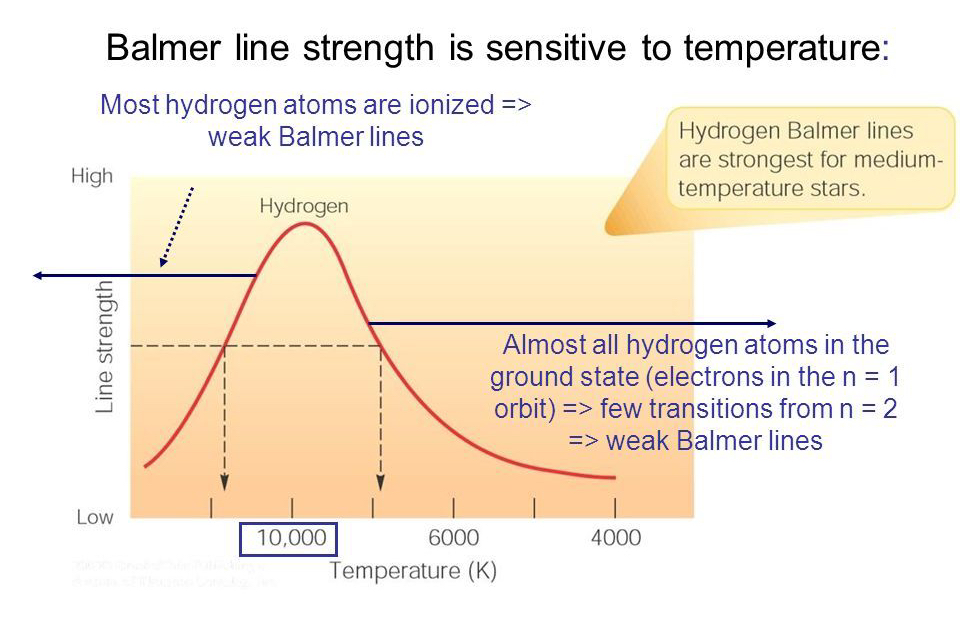
There’s one problem with this graph, though. Can you see it?
Take a look at the dotted black line—the horizontal one. It’s pointing out a specific line strength of the Balmer lines. But it corresponds to two points on the graph—one at about 20,000 K and the other at about 8000 K.
That’s a huge difference. How hot is this star?
In order to find out, we have to pull in some more Balmer lines—ones produced by a different atom from hydrogen.
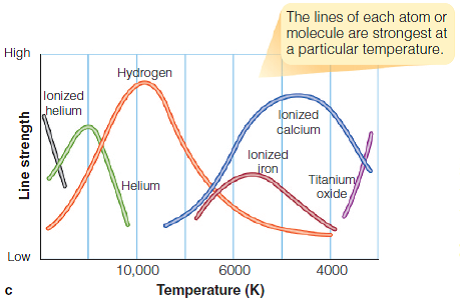
These curves are all showing the strength of Balmer lines, but they’re showing Balmer lines for different elements. What does that mean? They’re showing how many atoms in this star have electrons on the second energy level, regardless of which type of atom.
Now it’s easy to figure out how hot a star is.
If you know that hydrogen Balmer lines are of medium strength, you can’t be sure what temperature the star is—until you know that, say, helium lines are extremely strong. Then you know that the star is close to 20,000 K.
Titanium oxide lines help, too. Notice that titanium oxide isn’t an element—it’s a molecule. Most stars are so hot that molecules get stripped apart before they can exist for long. Only the coolest stars can have a molecule like titanium oxide.
There’s one drawback to all this. We can only use Balmer lines to figure out the surface temperature of stars. On the inside, stars are millions of degrees—far hotter than our measly 20,000 K.
But any energy produced inside doesn’t manage to get through the surface layer. Any energy that we can see has to have escaped the star and reached our instruments, so it was produced at the surface.
There are a ton of different types of stars, organized by temperature and color. They’ve been organized into specific spectral types, and I’ll cover them in my next post.
Very detailed article on light and temperature. My students learned a stars color indicated it’s temperature range. You’ve provided many more relevant details of the phenomenon. Great article.
LikeLiked by 1 person
Glad an actual science teacher thinks so.
LikeLike